What is a north star metric? The complete guide with 50 examples

A north star metric is the single measurement that best captures the value your product delivers to customers. When it grows, customer value and business results grow with it. Airbnb is commonly cited with nights booked, Spotify with time spent listening: one number that only moves when a real user gets real value.
The point of choosing one is focus. Teams juggling fifteen KPIs optimize whichever is easiest to move; a team with one north star and a tree of input metrics beneath it can trace every project to the same outcome. The discipline is in the choosing: a good north star measures delivered value rather than captured revenue, leads the business results rather than lagging them, and can actually be influenced by the teams accountable for it.
This guide covers what qualifies a metric, what disqualifies one, 50 examples across ten business models, and a step-by-step selection process. If you want a shortlist for your own product first, the free north star metric finder drafts candidates from a short product description, and the rest of this page will help you judge them.
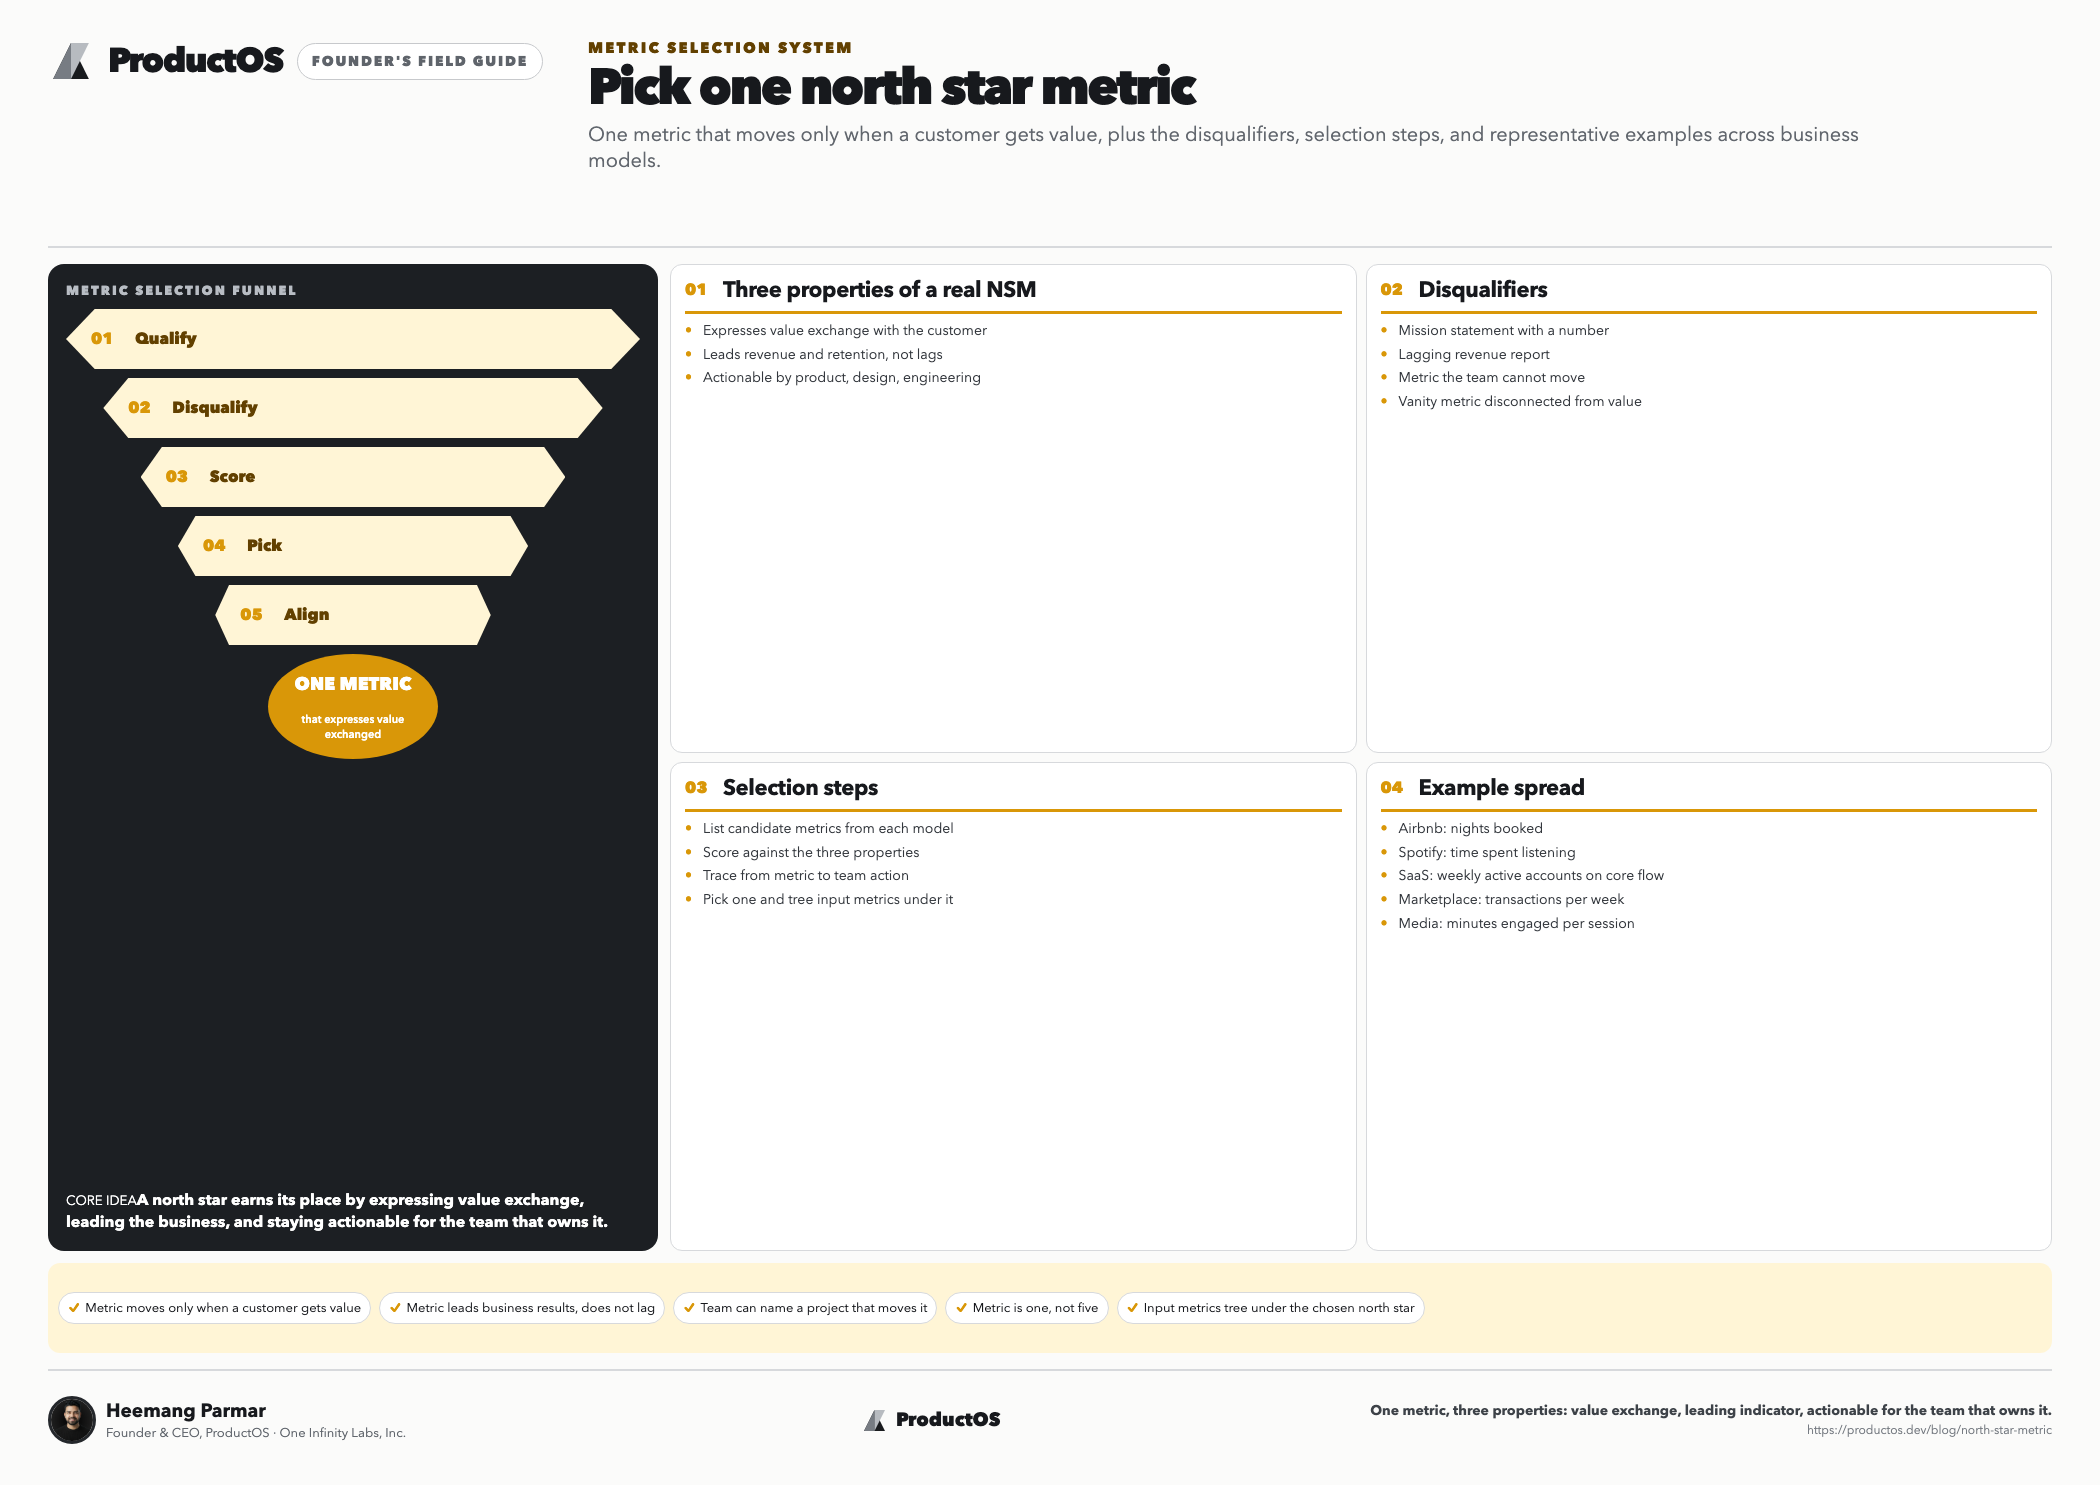
What is a north star metric?
A north star metric is the one number a product team commits to as its primary measure of success, chosen because it represents customers receiving value. The concept spread through the growth community, popularized by Sean Ellis, and was later systematized in Amplitude’s North Star Playbook as a framework for aligning teams.
Three properties separate a north star from an ordinary KPI. It expresses value exchange: the metric moves when a customer gets the thing they came for, not merely when they show up. It is a leading indicator: it predicts revenue and retention rather than reporting them after the fact. And it is actionable: product, design, and engineering decisions can visibly move it. The short version lives in our north star metric glossary entry.
Equally important is what a north star is not. It is not a mission statement with a number attached, not a vanity count of registered accounts, and not a replacement for your other metrics. It sits at the top of a metric tree; everything else becomes an input that explains or drives it.
What makes a good north star metric?
A good north star metric passes five tests: it measures value delivered to the customer, it leads revenue rather than lagging it, teams can influence it through product work, it is simple enough to explain in one sentence, and it resists gaming. Most weak candidates fail the first or the last test.
Run any candidate through this checklist:
- Value test. Does the metric move only when a user gets genuine value? Nights booked passes; app downloads fail, because a download delivers nothing yet.
- Leading test. Does it predict future revenue and retention? Weekly active teams predicts renewals; quarterly revenue only reports the past.
- Influence test. Can your teams move it with shippable work? A metric driven mostly by market cycles or sales headcount fails here.
- Clarity test. Can every person in the company repeat it and explain why it matters? Compound indices with four weighting factors fail this one.
- Gaming test. If a team optimized this number cynically, would customers still benefit? Time in app fails for a productivity tool, where more time can mean more frustration.
The gaming test deserves emphasis because it catches the most seductive mistakes. Any engagement metric can be inflated with notifications, dark patterns, and friction. The question is never can we make this number go up, but does this number going up force us to make the product better.
What are famous north star metric examples?
The commonly cited examples share one shape: a count of value moments, not a count of people or dollars. A note on sourcing: companies rarely confirm these publicly, so treat the list below as the versions widely reported in growth literature, with Amplitude’s being the exception since it published its own.
| Company | Commonly cited north star metric | Why it works |
|---|---|---|
| Airbnb | Nights booked | Value lands for guest and host at once; revenue follows mechanically |
| Spotify | Time spent listening | Listening is the product; it predicts retention and royalties |
| Uber | Weekly trips | Each trip is a completed value exchange on both sides of the marketplace |
| Netflix | Hours streamed per member | Viewing predicts renewal better than any survey |
| Slack | Messages sent within organizations | Messaging is adoption; teams that message daily rarely churn |
| Messages sent | Pure usage of the core action at network scale | |
| Daily active users | For an ad network, attention is the delivered inventory | |
| Amplitude | Weekly learning users (self-published) | Users who consume and share insights, not just log in |
| Duolingo | Daily active learners | Learning streaks compound into both outcomes and retention |
| Zoom | Weekly hosted meetings | Hosting is the committed action that spreads the product |
Notice what is absent: revenue, sign-ups, downloads, page views. Every metric above counts a moment where the product did its job. That is the pattern to copy, and it transfers to products of any size.
What are 50 north star metric examples by business model?
Your business model, not your ambition, determines the shape of your north star. Marketplaces count completed transactions, SaaS counts activated usage, media counts engaged attention, fintech counts money moved. The ten company examples above plus the forty below give you 50 starting points to adapt rather than invent from zero.
| Business model | Candidate north star metrics |
|---|---|
| B2B SaaS | Weekly active teams completing the core action; workspaces with three or more weekly active users; reports or documents generated per week; workflows automated per week; seats using the product three or more days a week |
| Consumer subscription | Daily sessions completed; weekly workout or lesson completions; day-30 users still completing the core action; content items finished per subscriber per week; active streaks maintained |
| Marketplace | Transactions completed per week; nights or appointments booked; gross value from repeat buyers; listing fill rate; time from search to first completed match |
| Social and community | Daily users who create or reply; messages sent per active user; posts receiving a response within an hour; weekly contributors; connections that lead to a conversation |
| Fintech | Weekly users moving money; funded accounts transacting monthly; total volume transferred per month; savings goals funded on schedule; cards transacting each week |
| Ecommerce and D2C | Repeat purchase rate; orders per customer per quarter; subscribers on auto-replenishment; 90-day repeat revenue; orders delivered on time and kept |
| Developer tools | Weekly active projects; API calls from production applications; successful deploys per week; teams with passing CI on the platform; time to first successful integration |
| Media and content | Total engaged reading or watch time; engaged sessions per reader per week; articles or episodes completed; returning weekly readers; subscriber time on owned channels |
| Health and wellness | Care plans followed week over week; appointments completed; daily check-ins logged; medication adherence rate; patients hitting tracked milestones |
| Education | Weekly active learners completing lessons; courses finished per cohort; skills assessed as mastered; assignments submitted on time; learners returning after 30 days |
Treat these as shapes, not answers. “Weekly active teams completing the core action” only becomes a metric when you define your core action, and that definition is the actual product decision. A CRM’s core action might be a logged customer interaction; a design tool’s might be a file shared for feedback. The candidate list narrows fast once the core action is named.
How do you choose a north star metric, step by step?
Choosing a north star is a one-to-two week exercise, not a quarter-long project. The sequence: name the value moment, list candidate metrics around it, run the five tests, check the metric against your data, choose one with an explicit revisit date, then build the input tree beneath it.
- Name the value moment. Complete this sentence: a customer has gotten what they came for when they ______. Everything else derives from this answer.
- List candidates around that moment. Count of the moment, users reaching it weekly, depth per user, and speed to first occurrence are the four usual shapes. Generate a shortlist, or let the north star metric finder draft one from your product description.
- Run the five tests. Value, leading, influence, clarity, gaming. Kill every candidate that fails two or more; be suspicious of any that fails the gaming test alone.
- Check it against history. If you have data, verify the candidate actually correlates with retention and revenue in past cohorts. A north star you cannot yet measure is a project, not a metric; sometimes that project is worth doing first.
- Choose one and set a revisit date. Write down the metric, its definition, its owner, and when you will re-evaluate it, typically every six to twelve months or at a strategy change. Ambiguity in the definition (what counts as active, which week boundary) is where alignment quietly dies.
- Build the input tree. Decompose the north star into three to five input metrics that teams can own directly. This is the step that turns a poster on the wall into a working system, and it gets its own section below.
One team habit makes the whole thing stick: every meaningful roadmap item should name the input metric it intends to move. If a project cannot name one, it is either strategic infrastructure or it is decoration, and both deserve to be labeled honestly. Prioritization frameworks plug in here; a RICE calculator scores impact far more honestly when impact means expected movement of a named input metric.
What is the difference between a north star metric, KPIs, and OKRs?
The north star is the destination, KPIs are the instrument panel, and OKRs are the itinerary for the next quarter. They coexist: the north star gives KPIs a hierarchy and gives OKRs a direction. Confusion arises only when teams treat every KPI as equally important or write OKRs unmoored from any metric.
| Concept | What it is | Time horizon | How many |
|---|---|---|---|
| North star metric | The single measure of delivered customer value | Years; revisited every 6 to 12 months | One per product |
| KPIs | Operational health measures across the business | Ongoing | A dashboard’s worth |
| Input metrics | The three to five drivers that decompose the north star | Quarters | Three to five |
| OKRs | Time-boxed objectives with measurable key results | A quarter | A few per team |
The practical wiring: key results in your OKRs should usually be movements in input metrics, which by construction roll up to the north star. Meanwhile guardrail KPIs (uptime, support response, margin) protect the business while you push. A north star without guardrails invites tunnel vision; guardrails without a north star invite drift.
What input metrics should support your north star?
Input metrics are the three to five measurable drivers that, multiplied or added together, produce your north star. Teams cannot move a top-line number directly; they can move breadth, frequency, depth, and efficiency. The decomposition turns one abstract goal into several concrete, ownable ones.
Most north stars decompose along the same four axes. Take “weekly meals ordered” for a food delivery product:
- Breadth: how many customers order at all each week (active orderers).
- Frequency: how often each active customer orders (orders per orderer).
- Depth: how much value each order carries (items per order, successful delivery rate).
- Efficiency: how fast a new customer reaches the first value moment (time to first order).
Each axis gets an owner: growth owns breadth, product owns frequency and efficiency, operations owns depth. Suddenly the north star is not a poster; it is a division of labor. AI can accelerate the mechanical parts of this work, drafting trees and challenging estimates, as covered in our guide to AI for product managers.
This decomposition also belongs in your specs. A well-formed product requirements document names the input metric its feature is meant to move, which is how strategy survives contact with the backlog.
What mistakes do teams make with north star metrics?
Five failure patterns account for most north star problems: choosing revenue, choosing vanity, choosing something unmovable, worshiping one number without guardrails, and never revisiting the choice. All five are recoverable, but each one quietly costs quarters of misdirected effort before it is caught.
- Revenue as the north star. Revenue is the result of value, not the measure of it, and it lags by months. It also gives product teams no daily signal. Keep revenue as the check that your north star is honest.
- Vanity counts. Registered users, downloads, and page views rise while the product fails. If the metric can grow without a single customer succeeding, it is marketing data, not a north star.
- Unmovable metrics. A north star dominated by seasonality, sales cycles, or market conditions demoralizes teams because shipping visibly changes nothing.
- No guardrails. A single metric pursued cynically produces notification spam and dark patterns. Pair the north star with two or three guardrail metrics that must not degrade.
- Set and forget. The right metric at 100 customers is often wrong at 10,000, and a strategy shift should trigger a review. Commonly cited example: Facebook’s early growth work reoriented around users reaching seven friends in ten days, an activation insight that mattered for a season, not forever.
Tips
- Pick a metric a customer would recognize as value received, not one that only your finance team cares about.
- If revenue is your north star, you are measuring the outcome, not the driver; move up one level to the behavior that earns it.
- Pair every north star with two or three input metrics an individual team can actually move this quarter.
- Review the metric quarterly, but change it rarely; a north star that shifts every sprint is a mood, not a strategy.
- Name the input metric each feature is meant to move inside its spec, so strategy survives the backlog.
How does ProductOS use north star metrics?
Two ways: a free standalone tool, and a place in the build pipeline. The north star metric finder takes a short product description and drafts candidate metrics with input trees, applying the tests from this guide, so you start your team discussion from a structured shortlist instead of a blank whiteboard.
Inside the platform, metrics are part of the spec, not an afterthought. The PRD agent writes success metrics as a first-class section of every product requirements document, drafted behind the same outline gate as the rest of the spec.
Because ten agents share one project context across the five stages, the metric defined at the Define stage is visible to the agents that design, build, and QA the product. The product managers page shows where metric definition sits in the full workflow.
Frequently asked questions
What is the difference between a KPI and a north star metric?
A north star metric is the single measure of customer value a product team aligns on; KPIs are the broader set of numbers that track operational health. Every north star is a KPI, but almost no KPI qualifies as a north star, because most KPIs (revenue, churn, uptime) either lag value or do not measure it. The north star sits at the top; KPIs surround and support it.
What is Uber’s north star metric?
Uber’s north star is commonly cited as weekly trips (sometimes phrased as rides per week). Uber has not formally published it, so treat it as reported rather than confirmed. It fits the pattern regardless: a completed trip delivers value to rider and driver simultaneously, scales with marketplace health on both sides, and predicts revenue mechanically, which is exactly what a marketplace north star should do.
What is Amazon’s north star metric?
Amazon has never published a single north star metric, and at its scale each business line tracks its own. Growth literature most often cites purchases per Prime member or overall purchase frequency as the retail proxy, reflecting Amazon’s stated flywheel of selection, convenience, and price. The honest answer is that the commonly cited versions are reconstructions, useful as patterns rather than facts.
What is the north star metric approach?
It is an operating method: choose one metric that captures delivered customer value, decompose it into three to five input metrics that teams own, tie roadmap work to those inputs, and protect the system with guardrail metrics. Popularized by Sean Ellis and systematized in Amplitude’s North Star Playbook, the approach trades dashboard sprawl for a single tree everyone can navigate.
Can revenue be a north star metric?
It is almost always a poor choice. Revenue lags customer value by months, gives product teams no daily signal, and can rise temporarily while value falls, through price increases or aggressive sales. The standard practice is to choose a value metric that demonstrably leads revenue, then use revenue as the audit: if the north star grows and revenue does not follow, you chose the wrong star.
What are the four types of performance metrics?
Business writing usually groups performance metrics into four buckets: business or financial metrics (revenue, margin), operational metrics (throughput, uptime), customer metrics (satisfaction, retention), and people or process metrics (velocity, quality). A north star metric deliberately cuts across the first three: it is a customer-value measure chosen because it predicts the financial ones, which is why it earns the top of the tree.
How often should you change your north star metric?
Revisit every six to twelve months; change it only when the strategy changes or the metric stops correlating with retention and revenue. Frequent changes destroy the alignment the metric exists to create, while never changing it lets a growth-stage company steer by a startup-stage number. The revisit should be scheduled and boring: check the correlation, check for gaming, reconfirm or replace.
How does ProductOS help define a north star metric?
The free north star metric finder drafts candidate metrics and input trees from a plain-language product description, applying the value, leading, and gaming tests automatically. If you build on ProductOS, the metric then travels with the project: the PRD agent writes success metrics into the spec, and downstream design and build agents work from the same shared context, so the number you chose stays attached to what ships.
One number will not run your product, but the right number will point everything else in the same direction. Name the value moment, pick the metric that counts it, and build the tree beneath it. If you want a structured first draft to argue with, generate one free with the north star metric finder, then apply the five tests before you commit.
CS engineer and IIM Lucknow MBA. Built products across enterprise and AI for 10+ years. Founded ProductOS to give every PM and founder the leverage of a full product team. Writes about AI product development, PRDs, and building with agents.