RICE prioritization: a practical guide with examples

RICE prioritization scores every feature or project with one number: (Reach x Impact x Confidence) / Effort. You estimate how many people a thing reaches, how much it moves the needle, how sure you are, and how much work it takes, then rank by the result. The point is not precision. It is forcing the same four honest questions on every idea so the loudest voice in the room stops winning by default.
Here is how RICE prioritization actually works, with the scoring scales, a worked example table, and the mistakes that quietly break it. The framework comes from Intercom, who built it because their old gut-feel roadmap kept over-weighting flashy features nobody used.
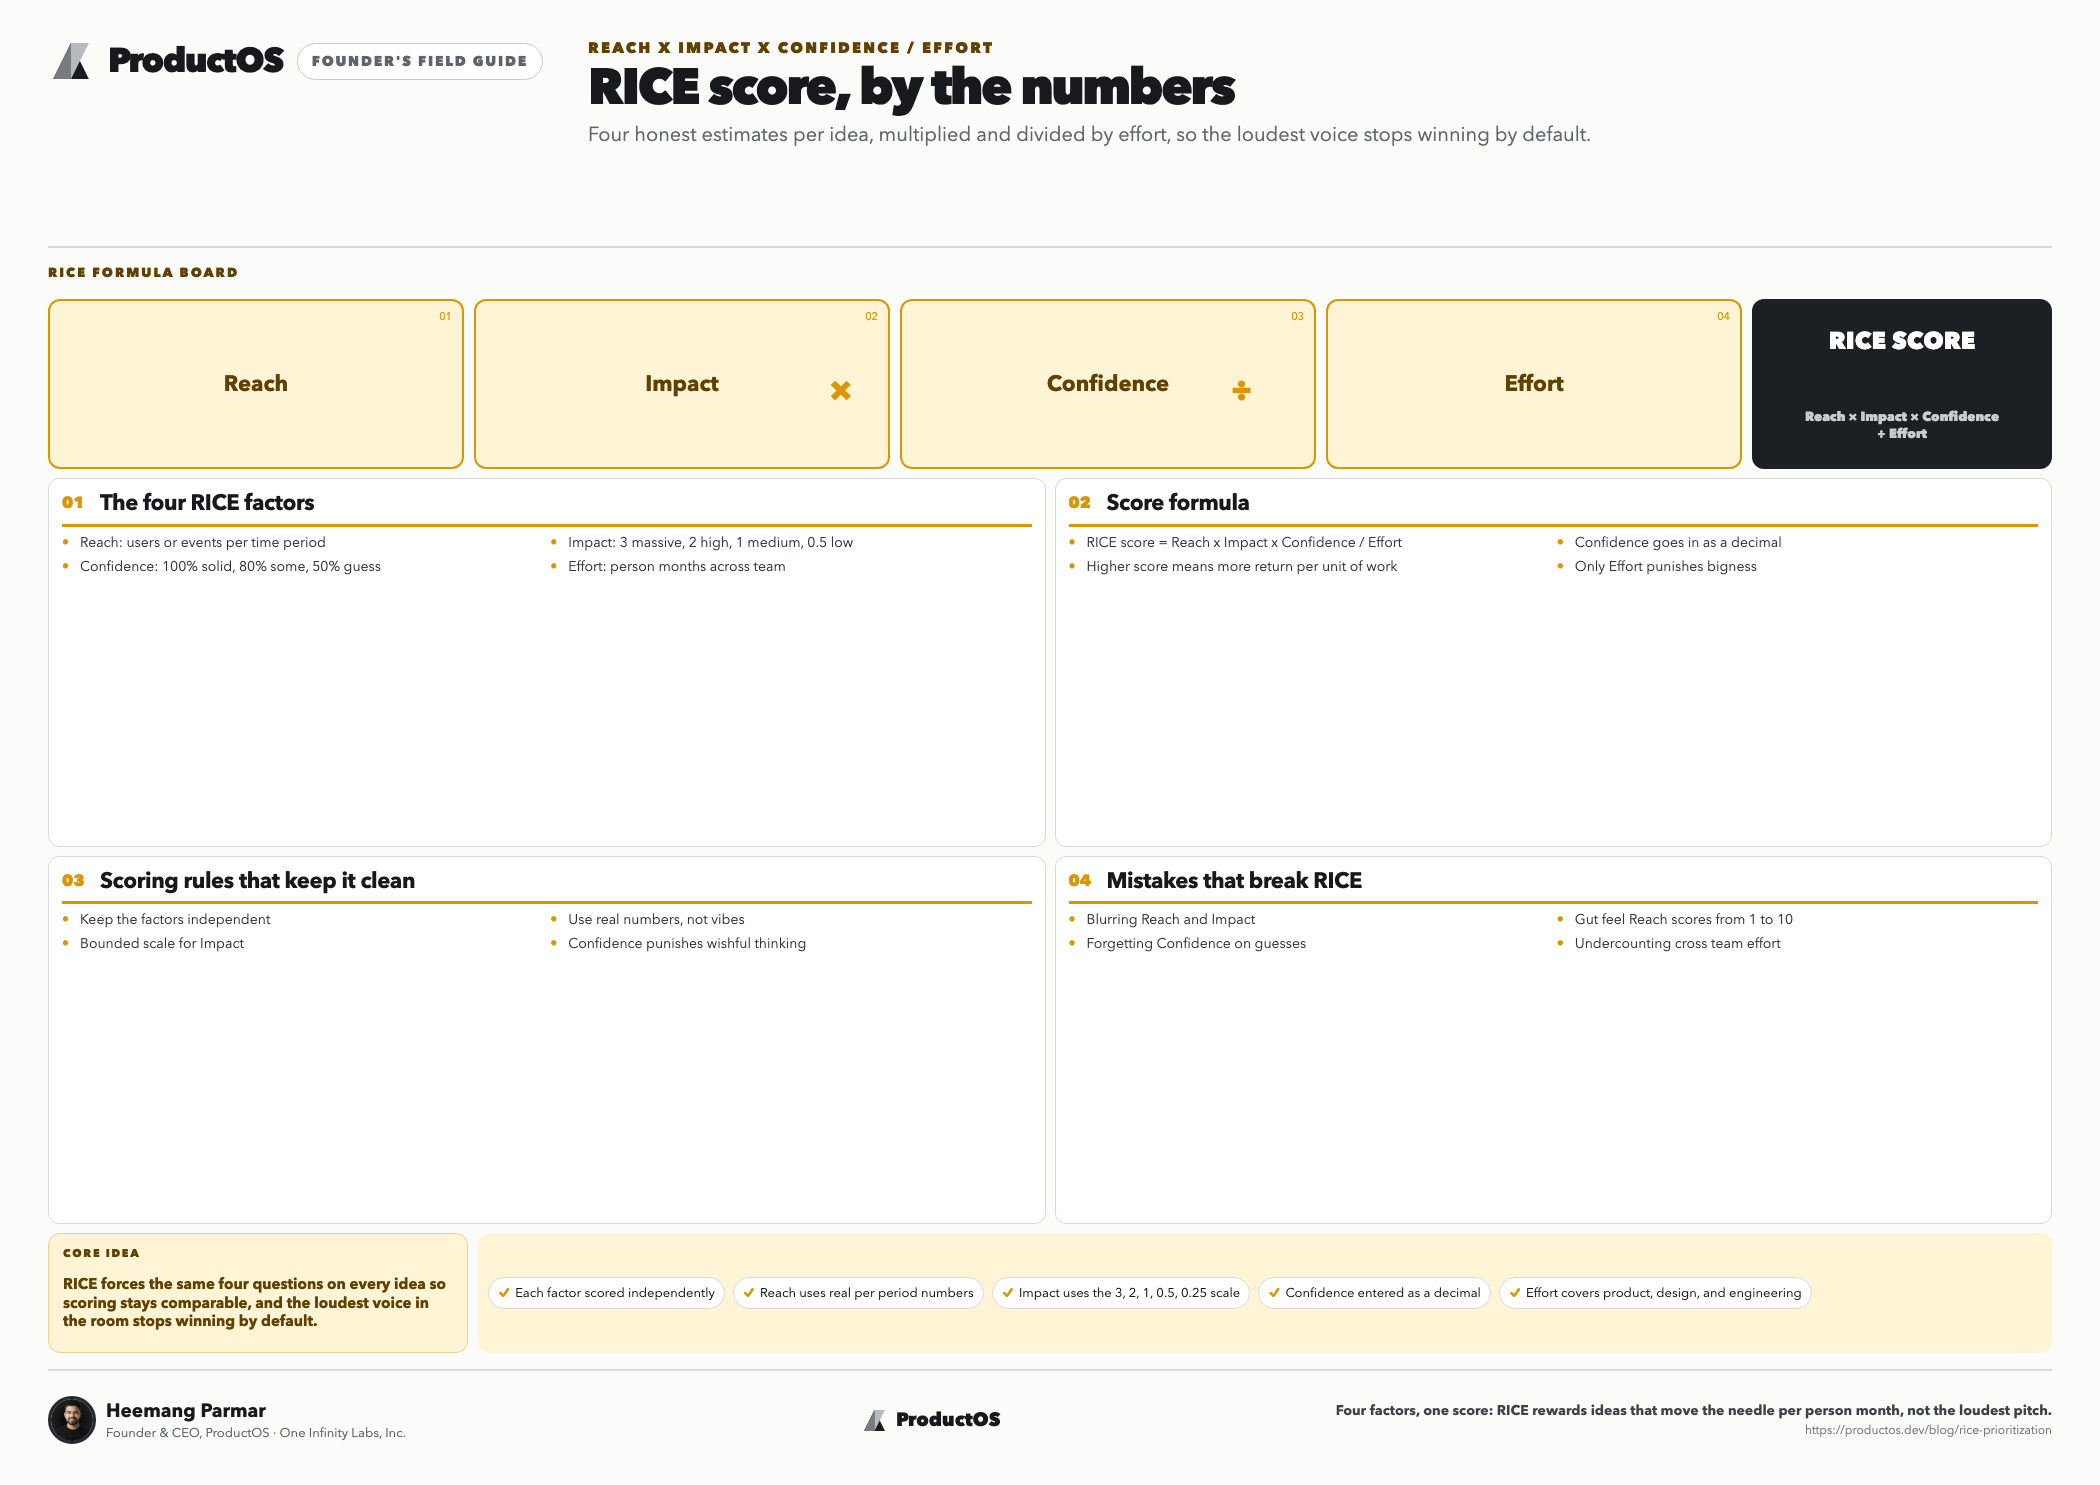
The four RICE factors
Each letter is a separate estimate. Keep them independent, that is the whole trick. Reach and Impact answer different questions, and blurring them is where most scoring goes wrong.
- Reach. How many people or events this affects in a set time period, per quarter, per month, whatever you pick. Use real numbers from your data, not a 1 to 10 vibe. “1,200 users hit this flow per month” beats “high reach.”
- Impact. How much it moves your goal per person. Use a fixed scale so it stays comparable: 3 = massive, 2 = high, 1 = medium, 0.5 = low, 0.25 = minimal. This is judgment, and that is fine, the scale keeps it bounded.
- Confidence. How much you trust your own Reach and Impact numbers, as a percentage. 100% = solid data, 80% = some evidence, 50% = an educated guess. This is the factor that punishes wishful thinking.
- Effort. Total work in person-months across product, design, and engineering. A month of one person’s time is 1. This is the denominator, so it is the only factor where bigger is worse.
The RICE score formula
Multiply the first three, divide by Effort:
RICE score = (Reach x Impact x Confidence) / Effort
Confidence goes in as a decimal (80% becomes 0.8). The output is roughly “goal-impact per unit of work,” so a higher score means more return for the effort. The absolute number is meaningless on its own. It only matters relative to the other scores on your list, which is exactly why you score everything the same way before you rank.
A worked example
Say you run a B2B SaaS product and you are choosing what to build next quarter. You have four candidates. Here is each scored with the same scales, Reach measured as users affected per quarter, Effort in person-months.
| Feature | Reach | Impact | Confidence | Effort | RICE score |
|---|---|---|---|---|---|
| SSO / SAML login | 800 | 2 | 100% | 4 | 400 |
| Onboarding checklist | 3,000 | 1 | 80% | 2 | 1,200 |
| AI report summaries | 1,500 | 2 | 50% | 5 | 300 |
| Dark mode | 2,000 | 0.25 | 100% | 1 | 500 |
Do the math on one row so the mechanic is clear. Onboarding checklist: (3,000 x 1 x 0.8) / 2 = 1,200. AI report summaries looks exciting and has high Impact, but low Confidence and heavy Effort drag it to 300, dead last. Dark mode, the feature everyone assumes is trivial fluff, scores 500 because it is cheap, certain, and touches a lot of users, even at minimal impact per person.
That inversion is the value of RICE. The ranking here is onboarding checklist, dark mode, SSO, then AI summaries, which is almost certainly not the order the team would have argued for in a meeting. The number does not make the decision for you, but it makes you defend why you would override it.
How to run RICE without fooling yourself
Define the goal first. Impact is “impact on what?” If you have not named the outcome, activation, retention, revenue, your Impact scores are noise. Anchor them to your north star metric so every feature is measured against the same target.
Pull Reach from data, not memory. Open analytics and get the actual count of users or events. The moment Reach becomes a guess, the whole score is a guess wearing a lab coat.
Score Impact and Effort as a group. Have engineering size Effort and have design and product weigh in on Impact. Solo scoring bakes in one person’s blind spots. Ten minutes of disagreement here is cheaper than a quarter spent on the wrong thing.
Let Confidence do its job. If you are inventing the Reach and Impact numbers, your Confidence should be 50% or lower, and it should visibly tank the score. Confidence is the built-in humility check, do not round it up to feel better.
Rank, then sanity-check. Sort by score and read the top of the list. If something feels obviously wrong, do not overwrite the number, find the input that is off. Usually it is an Effort estimate that was optimistic or a Reach that was inflated.
Pitfalls that break RICE
- Fake precision. RICE outputs a specific number, which tempts people to treat 412 as meaningfully better than 389. It is not. Treat scores as buckets: clearly high, clearly low, and a messy middle where judgment takes over.
- Confidence inflation. Everyone marks their pet project 100%. If your whole backlog is high-confidence, the factor is doing nothing. Reserve 100% for things you have actually measured or shipped before.
- Effort as an afterthought. Underestimating Effort is the single biggest source of bad scores, because it is the denominator and small errors swing the result hard. Get a real estimate from the people who will build it.
- Reach and Impact double-counting. A feature that reaches many people does not automatically have high Impact per person. Keep them separate, or you reward popularity twice.
- Scoring vague ideas. RICE needs a defined thing to estimate. If the feature is still a fuzzy notion, you cannot score Reach or Effort honestly. Write the product requirements document first, then score what it actually describes.
RICE is a thinking tool, not an oracle. Its job is to make estimates explicit and comparable so the roadmap conversation is about evidence instead of volume. Use it to structure the debate, then trust a human to make the call on the close ones.
Frequently asked questions
What does RICE stand for?
Reach, Impact, Confidence, and Effort. Reach is how many people or events a feature affects in a time period, Impact is how much it moves your goal per person, Confidence is how sure you are of those estimates as a percentage, and Effort is the total work in person-months.
What is the RICE scoring formula?
RICE score = (Reach x Impact x Confidence) / Effort. You multiply the first three factors and divide by Effort, entering Confidence as a decimal like 0.8 for 80%. A higher score means more expected goal-impact per unit of work.
What scale should I use for Impact?
Intercom’s standard scale is 3 for massive, 2 for high, 1 for medium, 0.5 for low, and 0.25 for minimal. Using a fixed set of values keeps Impact comparable across features instead of drifting into a subjective 1 to 10 rating that means something different for each person.
How is RICE different from a simple value vs effort matrix?
A value/effort matrix collapses everything into two axes and hides your assumptions. RICE splits “value” into Reach, Impact, and Confidence, which forces you to separate how many people are affected from how much it helps each one, and to state how sure you are. That extra structure catches flashy-but-uncertain bets that a 2×2 would wave through.
Is RICE worth it for a small team or early-stage product?
Yes, but keep it lightweight. Even with rough numbers, the discipline of scoring every idea the same way beats arguing from opinion. Early on, your Confidence scores will and should be low, which is a useful signal that you are betting, not knowing.
CS engineer and IIM Lucknow MBA. Built products across enterprise and AI for 10+ years. Founded ProductOS to give every PM and founder the leverage of a full product team. Writes about AI product development, PRDs, and building with agents.